

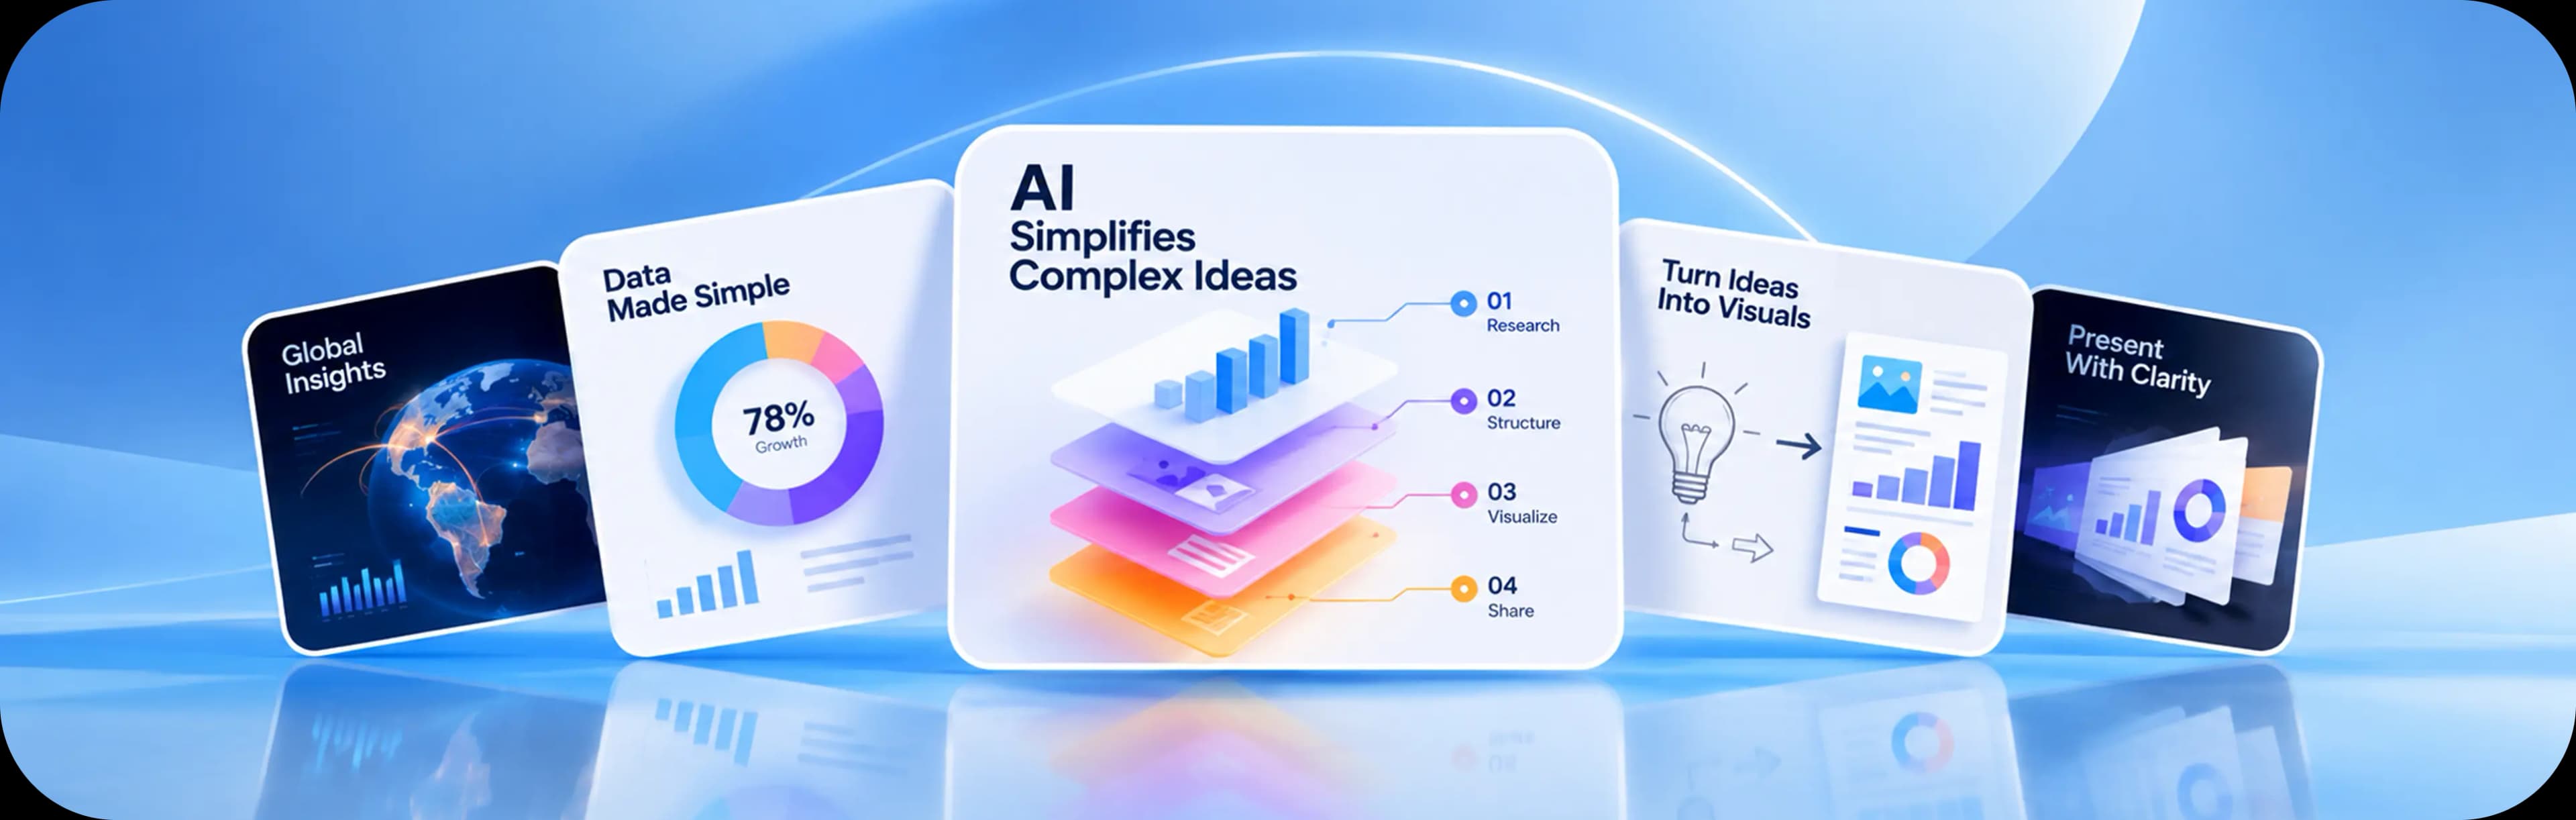
Turn Complex
Information Into
Clear Visual Stories
Transform ideas, processes, data, and information into structured infographics designed to make complex content easier to understand and remember. Choose a visual structure, shape your content, define the brand, and generate the final visual.
Free usage available
Structure Before
Design
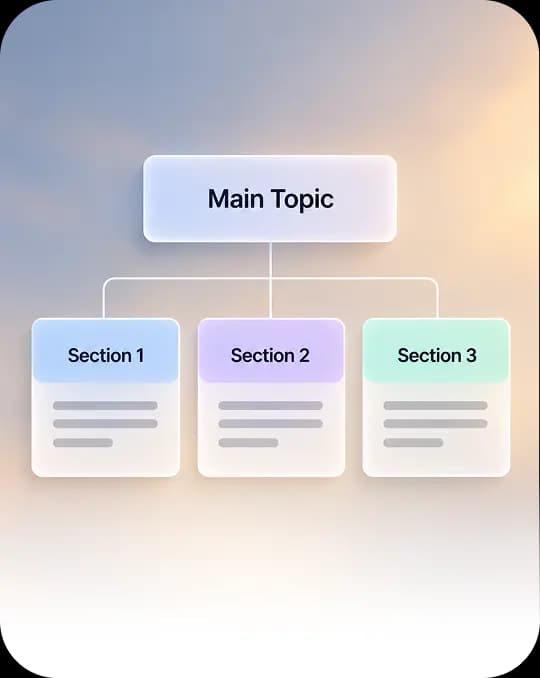
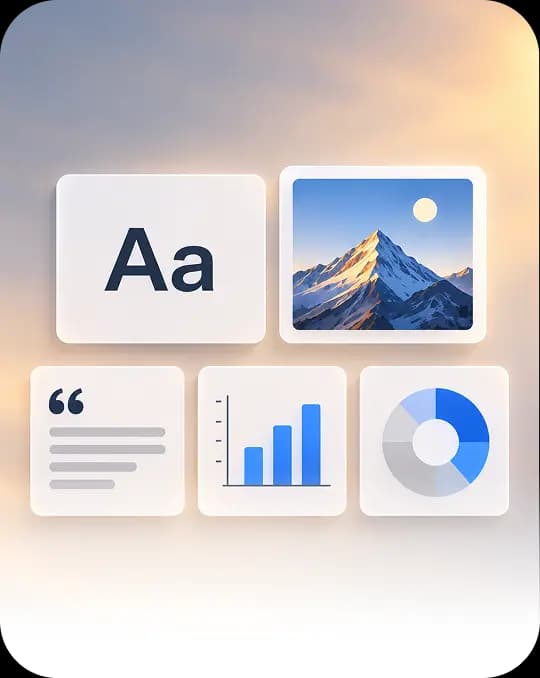
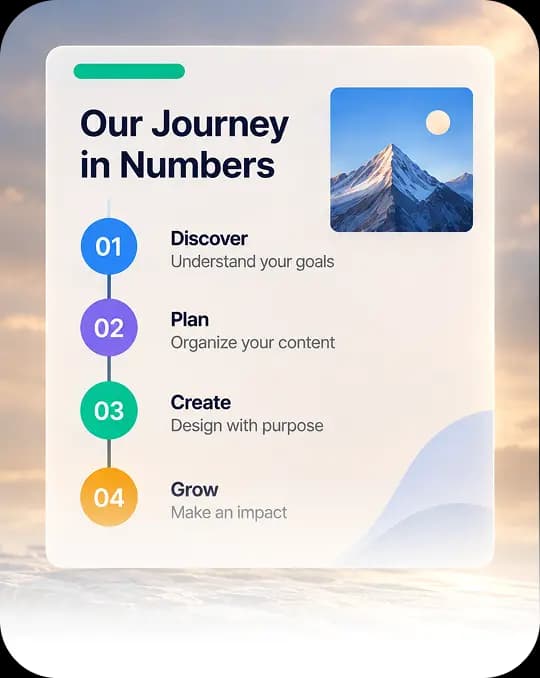
From Information to
Infographic
Turn a Content Brief Into a Designed Story
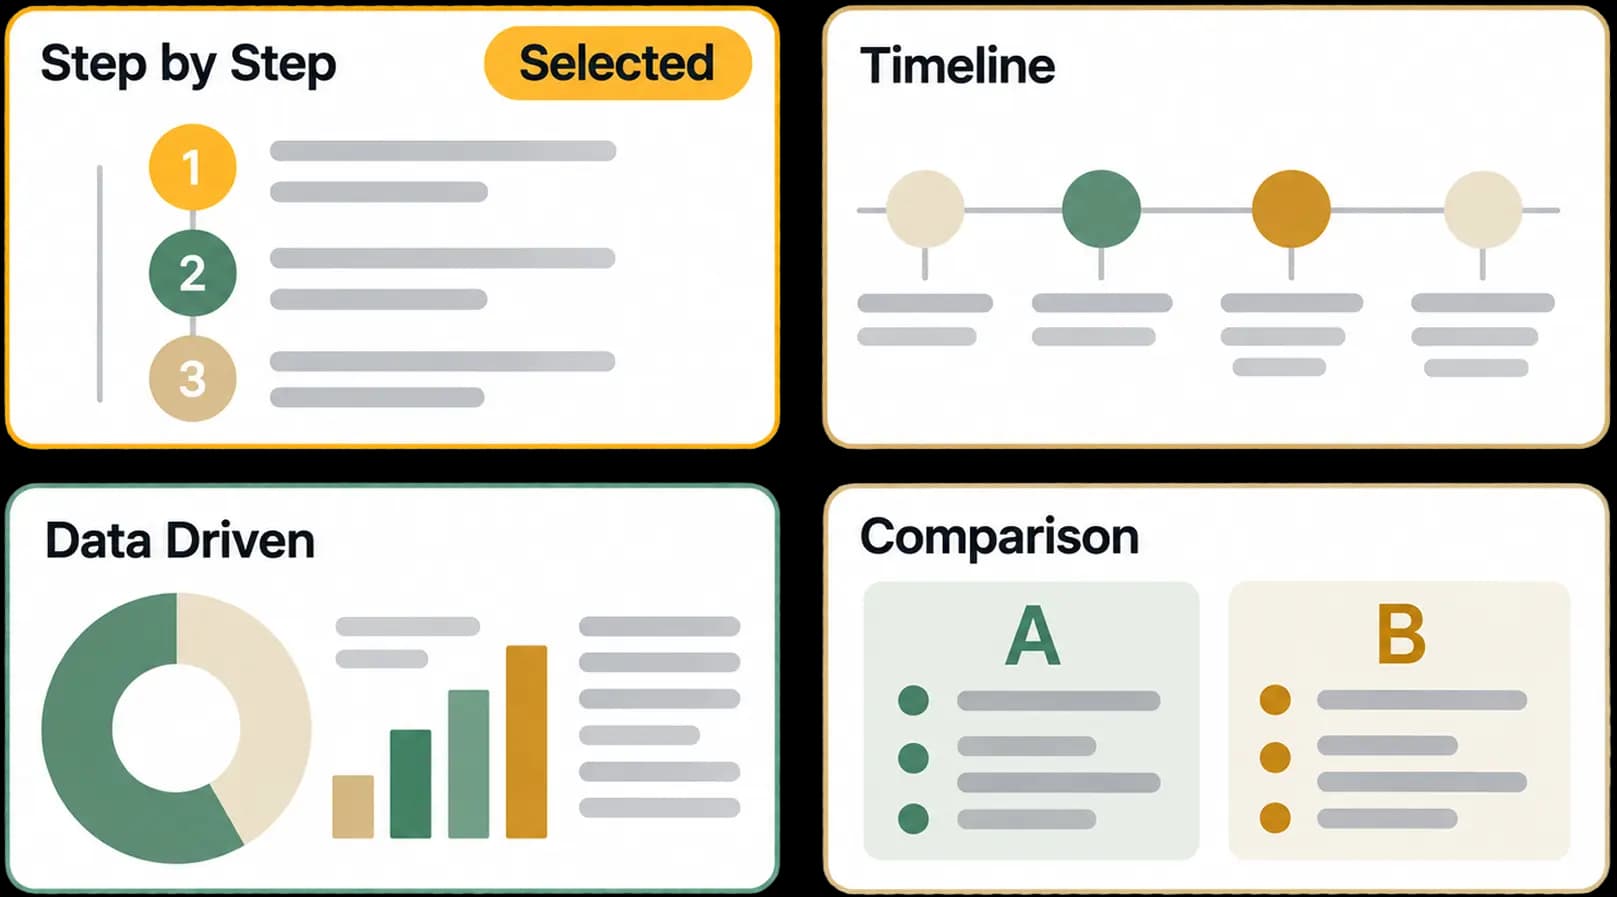
Choose Your Structure
Select the layout that best fits your information, from timelines and roadmaps to narrative and data-driven formats.

Built for Everyone Who
Communicates Information
Make Information Easier to Explain
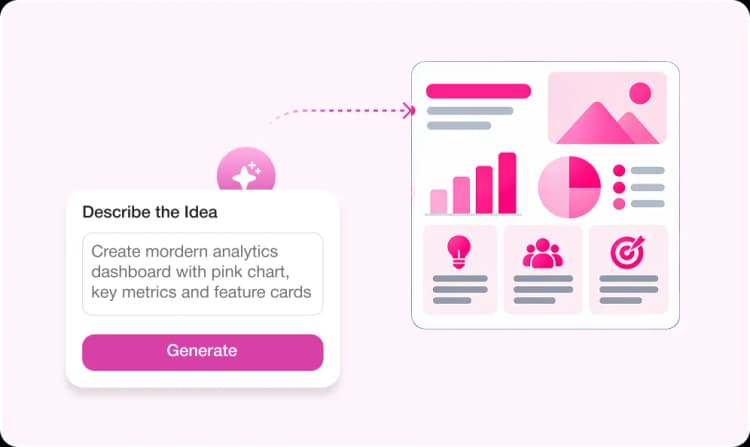
First-Time Creators
Turn information into polished visuals without needing design or infographic expertise.
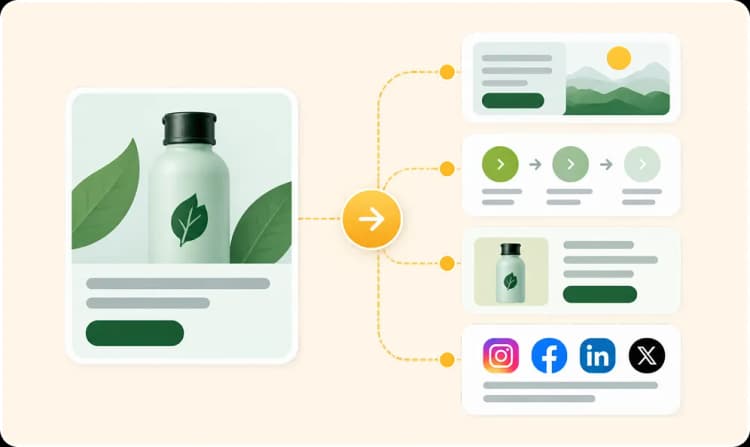
Marketing Teams
Create visual content for campaigns, customer journeys, product stories, and communications.
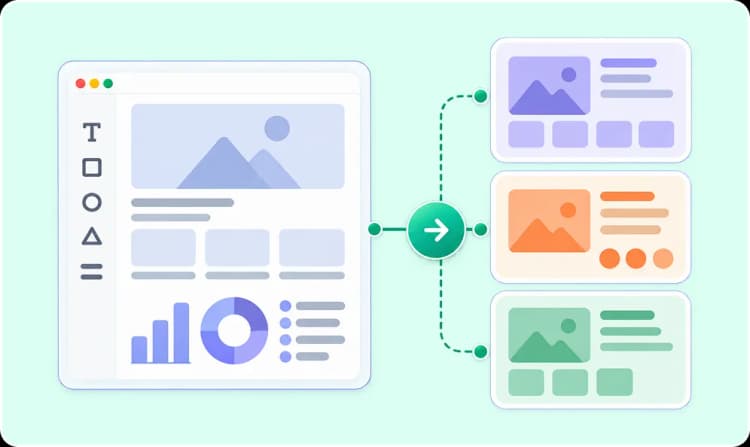
Designers
Explore structured compositions and visual directions for information-heavy content.
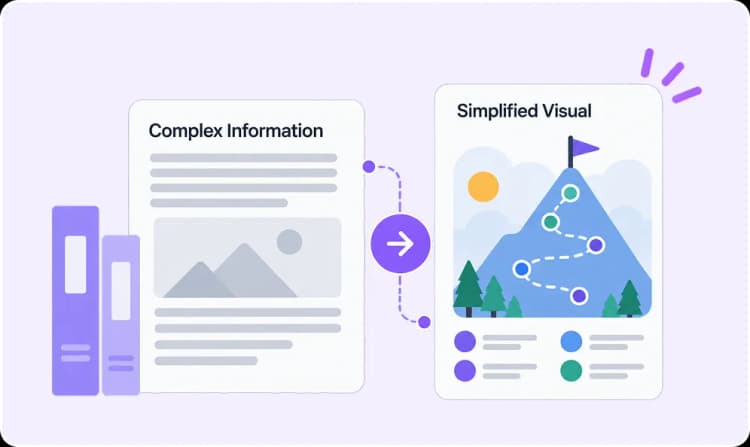
Educators & Researchers
Make processes, concepts, findings, and complex information easier to understand.
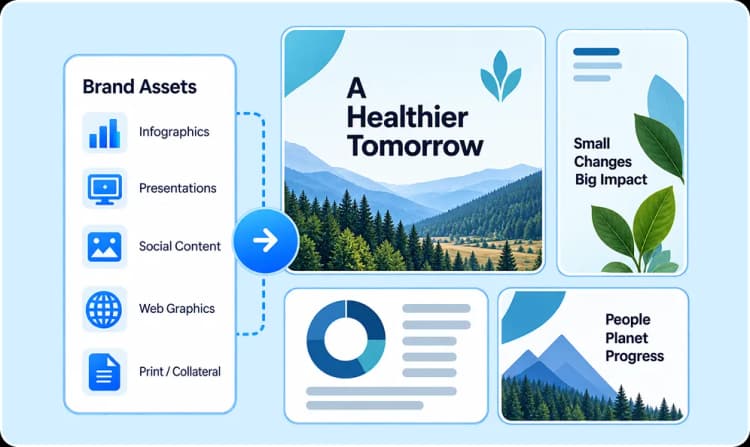
Brands & Agencies
Develop branded infographics for presentations, websites, social content, and business communication.
More Than Putting Content
Into a Template
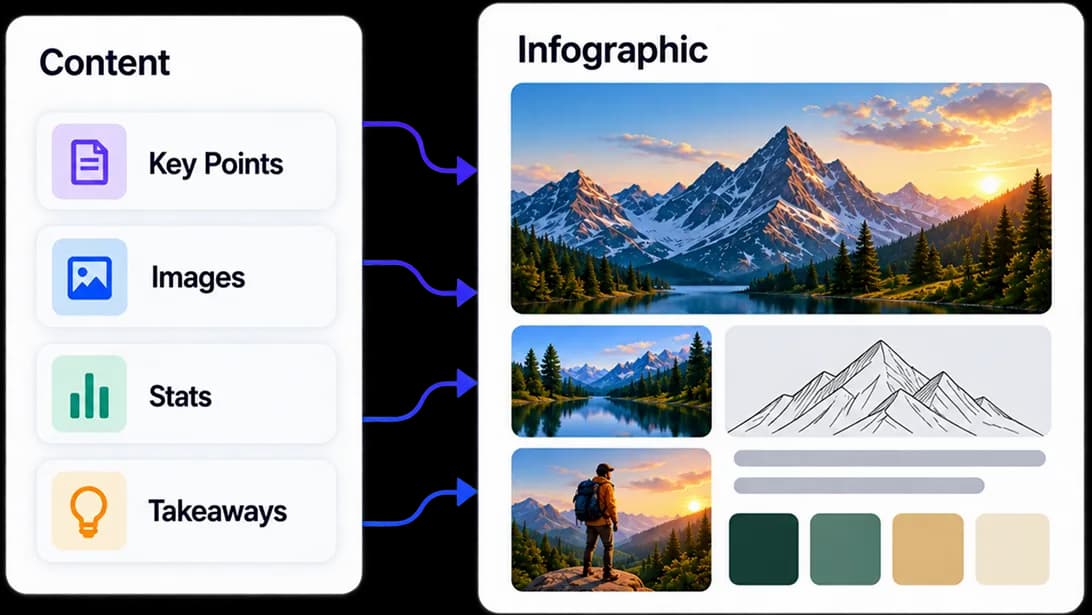
Build the Visual Logic Around Your Information
Infographic Studio connects content structure, visual hierarchy, and brand direction before generating the final infographic.
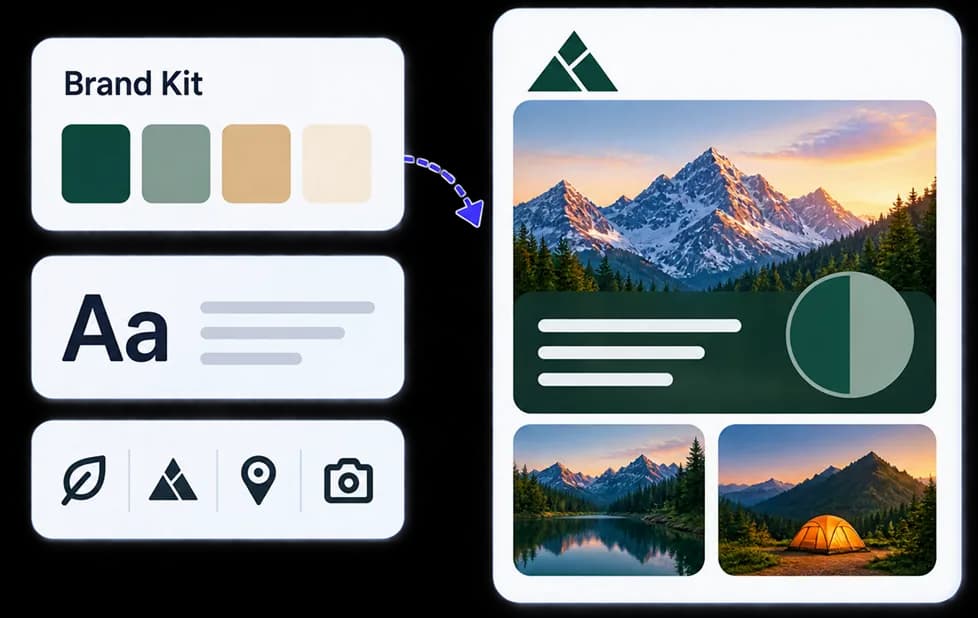
Brand-Controlled Design
Set colors, typography, brand presets, and aspect ratio so the infographic fits your visual identity.
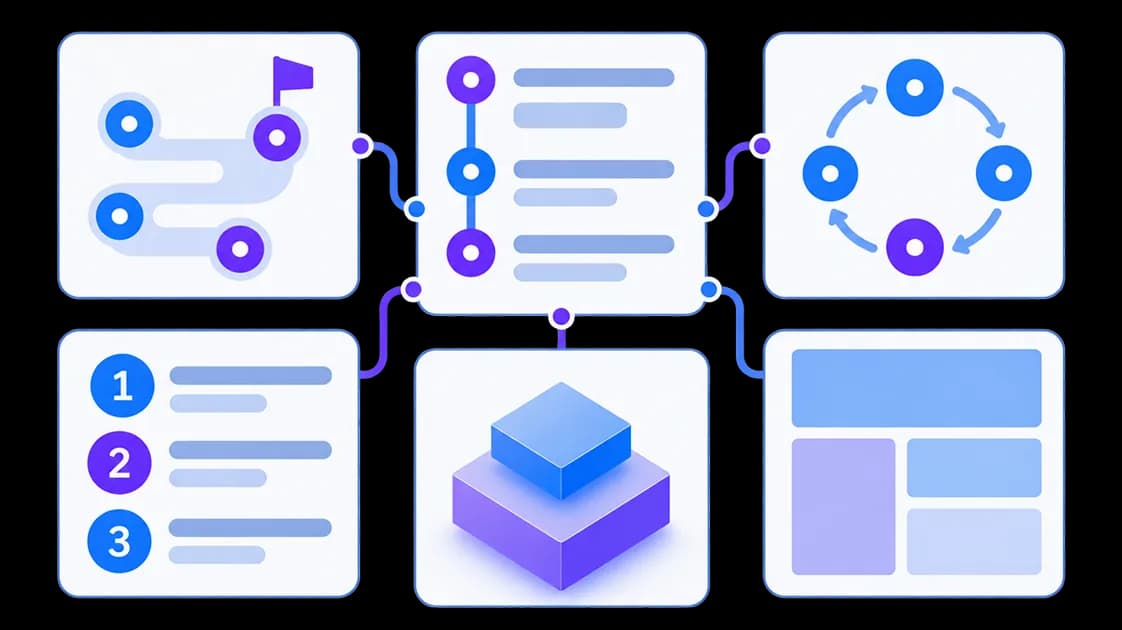
Purpose-Built Layout Systems
Choose from visual structures including timelines, roadmaps, circular flows, zig-zag narratives, scrollytelling, modular grids, isometric systems, and data-driven layouts.
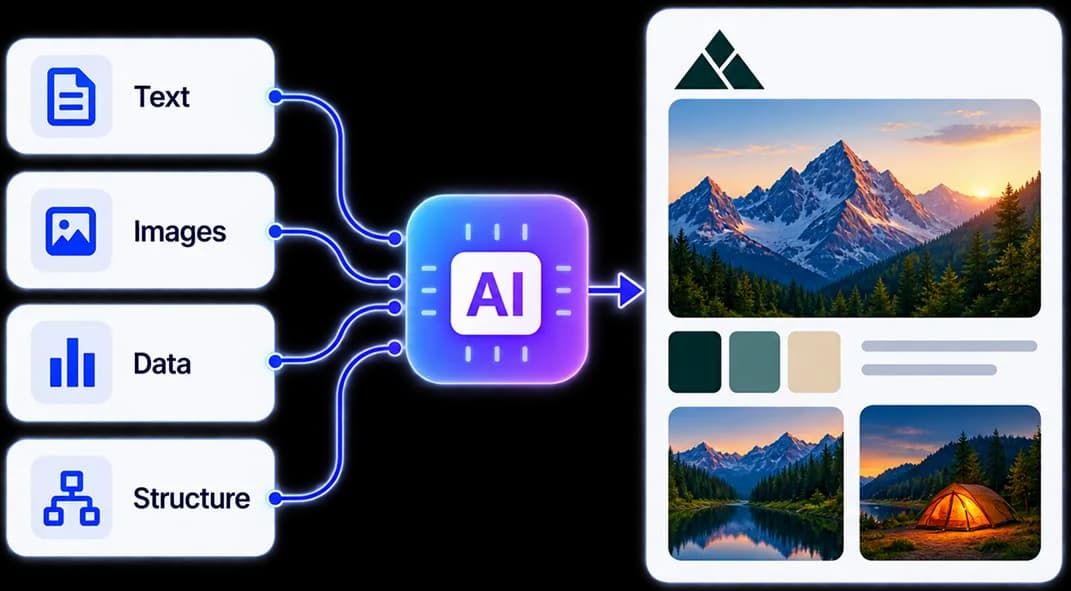
Content-Aware Generation
Use generation designed around the relationship between information, hierarchy, visual elements, and layout.
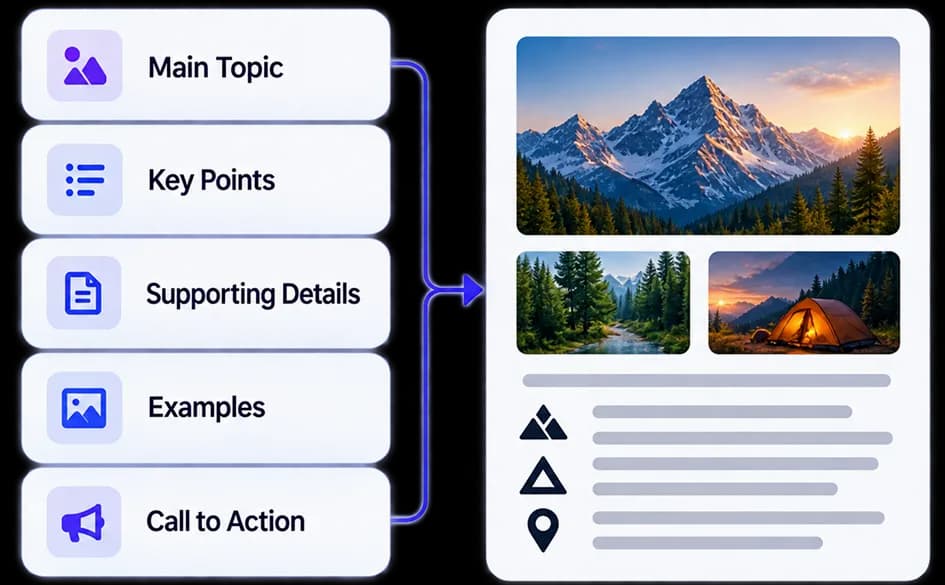
Structured Content
Turn a simple brief into organised steps, milestones, takeaways, supporting descriptions, and calls to action.
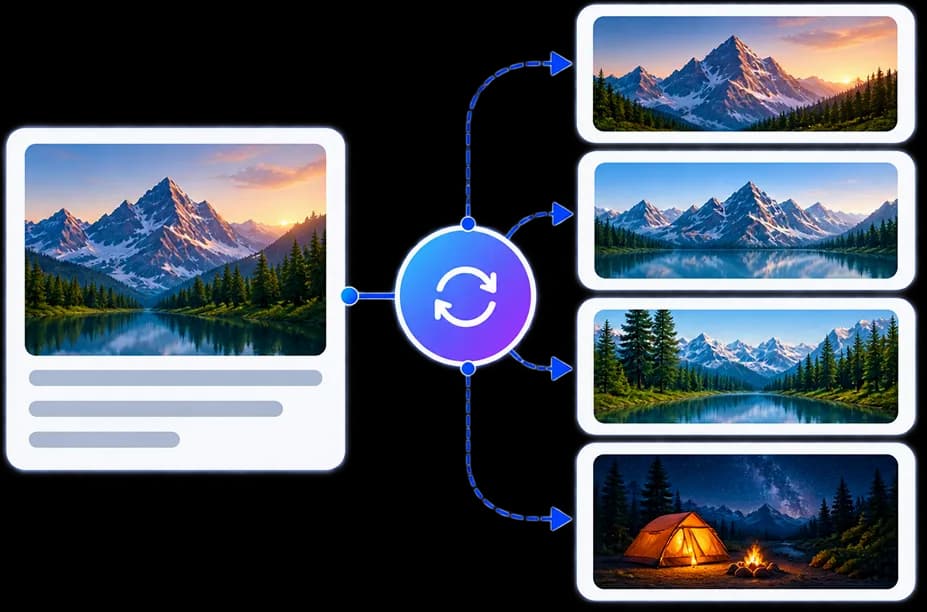
Explore Beyond the First Result
Regenerate, create variations, re-expand content, and compare different visual interpretations of the same information.

Don't just make information look designed.
Make it easier to understand.

Your Questions Answered
Frequently Asked Questions
Infographic Studio is an AI-powered workspace for turning information, processes, data, and ideas into structured visual infographics.
No. Infographic Studio guides you through structure, content shaping, and visual direction—so you can create polished infographics without design or infographic expertise.
Create timelines, roadmaps, process flows, data-driven layouts, comparison visuals, scrollytelling narratives, modular grids, and other structured information graphics.
Yes. Describe your topic, steps, milestones, takeaways, and supporting details in a brief—or bring existing information to organise into a clear visual hierarchy.
Yes. Choose layout structure, visual direction, aspect ratio, and other design controls before generating the finished infographic.
Yes. Set brand colors, typography, and presets so the infographic fits your visual identity.
Yes. Regenerate, create variations, and compare different visual interpretations of the same information before choosing the strongest result.
Yes. You can start creating with Infographic Studio for free, then upgrade when you need more generations or advanced features.

Make Your Information
Easier to Understand
Give your content a structure, give it a visual direction,
and turn it into an infographic people can follow.